
The Observability Interpretation Layer: Decoupling Routing from Intelligence
Distributed tracing depends entirely on a consistent schema. If your Load Balancer, Application, and Database don't agree on how to format a Trace ID, you have three isolated piles of text instead of a “trace”.
This is the default state for most infrastructure. AWS ALBs emit space-delimited text with versioned IDs. Java applications throw multi-line stack traces. PostgreSQL writes to Syslog. When a request hits this stack and fails, the engineer on call has to manually grep and correlate timestamps because the tools can't link the events automatically.
We can solve this by normalizing data in motion. Instead of dumping raw text into storage and hoping for the best, we can transform these messy sources into the OpenTelemetry (OTEL) standard within the pipeline itself.
The Problem: Data Fragmentation
To demonstrate the challenge, we created a synthetic dataset representing a cascading failure in a checkout API. In this scenario, a connection leak in the application triggers a distinct chain reaction: the database refuses connections (logging FATAL errors), causing application threads to block (logging 504 timeouts), which eventually exhausts the heap (logging OutOfMemoryError).
1. The Suspect (AWS ALB) The investigation begins with a 504 error on the load balancer. The ALB provides a Trace ID with Root= prefix, which becomes our primary lead:
h2 2026-01-09T14:01:05.123Z app-lb 172.16.0.1:443 10.0.5.20:8080 0.001 5.002 0.000 504 - 134 456 "GET /checkout HTTP/2.0" "Root=1-67891233-a0b1c2d3e4f5678901234567"2. The Dead End (Java Application) Then we hit the Java Application layer. Here, the logs switch to a standard UUID format inside brackets, completely mismatching the ALB ID "Root=1-67891233-a0b1c2d3e4f5678901234567". The Java app stripped the AWS-specific "Root" prefix, logging only the internal ID. The link is broken instantly:
2026-01-09 14:01:04,988 ERROR [http-nio-8080-exec-5] [trace_id=67891233-a0b1c2d3e4f5678901234567] com.acme.checkout.CartService: Critical failure
java.lang.OutOfMemoryError: Java heap space
    at java.util.Arrays.copyOf(Arrays.java:3332)
    at com.acme.checkout.CartService.process(CartService.java:105)
3. The Silent Killer (PostgreSQL) And way down in the PostgreSQL database, we lose the trace entirely. It is logging in a completely different format, Syslog, relying only on timestamps to tell us what went wrong:
Jan 9 14:01:05 db-inventory-01 postgres[12234]: [5-1] user=inventory_svc,db=inv_prod FATAL: remaining connection slots are reservedWe have trace IDs in the first two logs, but the formats don't match (the ALB adds that annoying Root= prefix). The database is even worse—it has no trace ID at all, so we're stuck guessing based on timestamps. In a production incident, reconciling these differences requires manual correlation or complex query logic, significantly increasing Mean Time To Resolution (MTTR).
The Architecture: Decoupling Routing from Processing
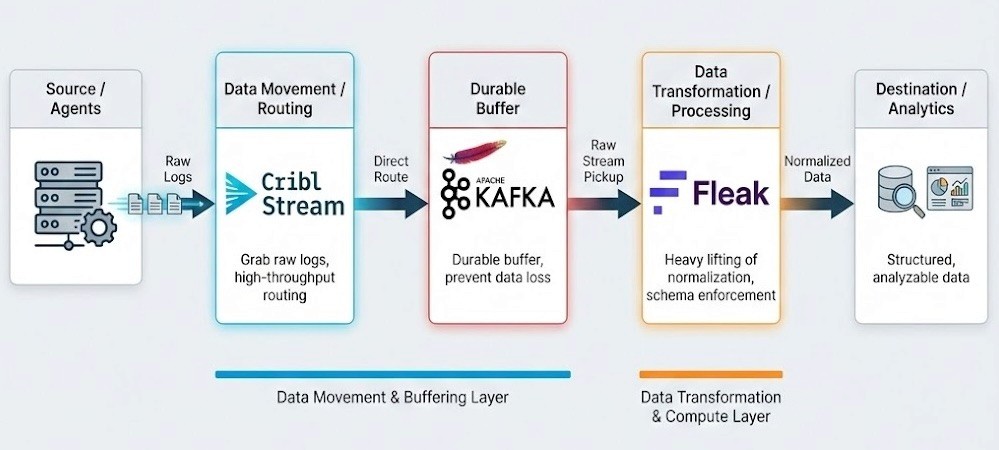
A production-ready observability pipeline separates data movement from data transformation. For this implementation, we built a pipeline that separates these concerns.
We use Cribl Stream to grab the raw logs off the agents and route them directly into Kafka. This gives us a durable buffer so we don't lose data if the downstream processing layer chokes or needs to be paused. From there, Fleak picks up the raw stream to handle the heavy lifting of normalization.
Architect's Note: Why separate 'Routing' (Cribl) from 'Compute' (Fleak)? You might look at this stack and ask: "Cribl can parse JSON. Why are we chaining two engines?"
It comes down to avoiding Head-of-Line Blocking.
We treat Cribl Stream as the "Logistics Layer." Its primary job is to get data off the edge and into the buffer (Kafka) as fast as possible. If we load the edge nodes with CPU-intensive tasks—like recursive OTEL schema mapping or AI-based inference—we risk creating back pressure that slows down raw ingestion.
We treat Fleak as the "Compute Layer." Normalizing a messy stack trace into OTEL is legally "compute-bound" work. By isolating this logic after the Kafka buffer, we ensure that complex transformations never block the raw data flow.
Implementation: Normalizing to OpenTelemetry
With the architecture set, the implementation becomes purely about logic. We use Fleak's visual DAG builder to automate the three critical steps required to unify the data: branching, parsing, and semantic mapping.
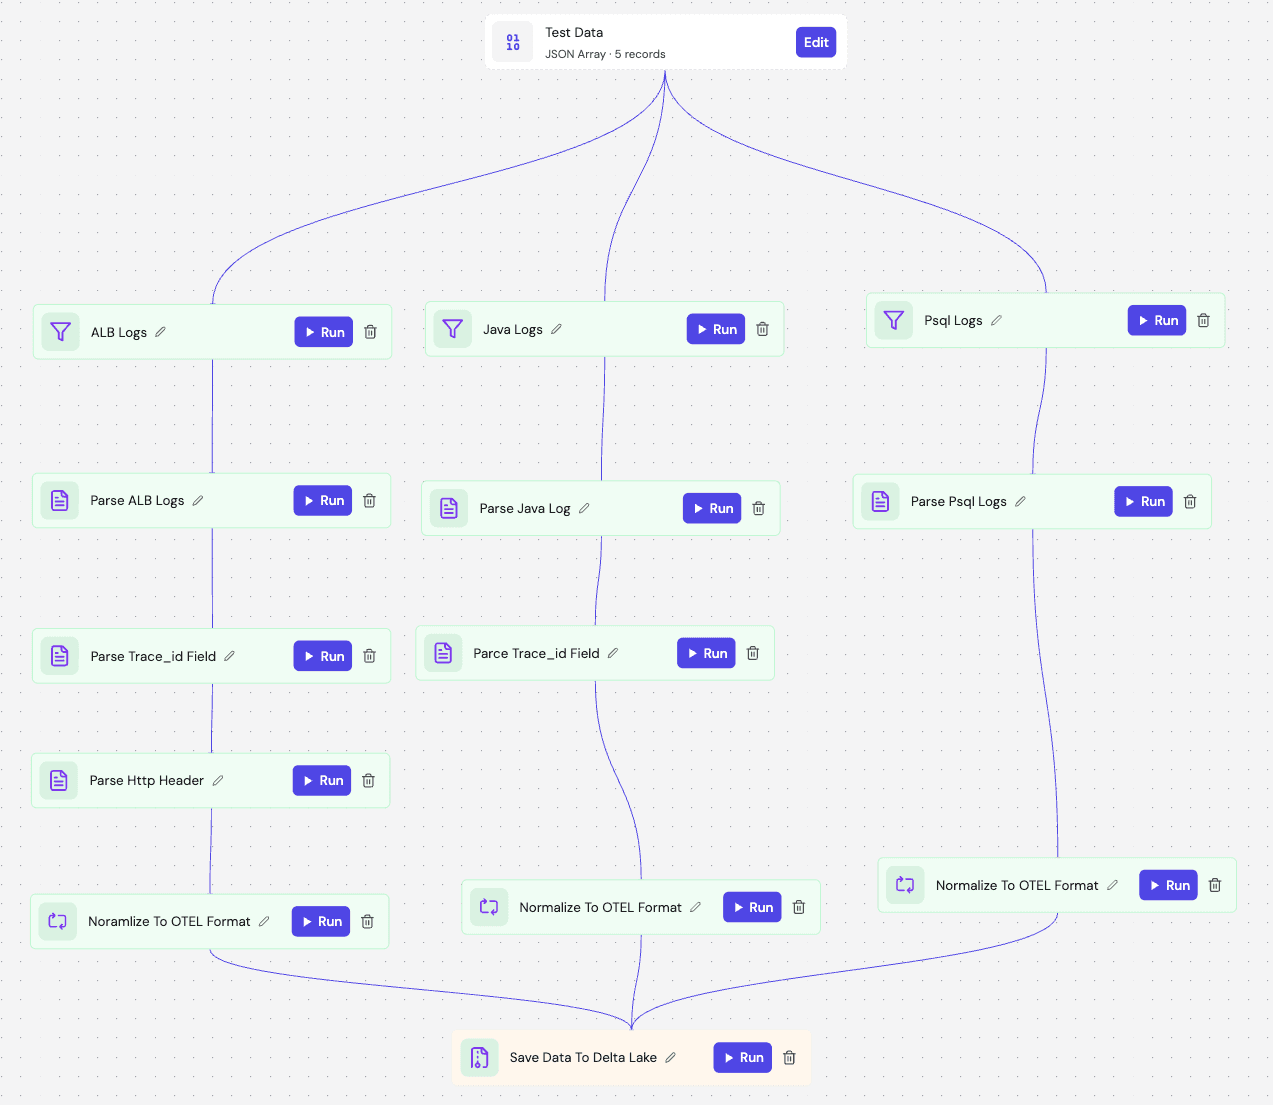
1. Branching and Parsing with Zero Code
The first challenge is separating the mixed stream. In the DAG, we use Filter Nodes with simple Regex expressions to identify the source type—branching h2 logs to the ALB branch and stack traces to the Java branch.
Once branched, we don't need to write custom parsers. We simply drop in a Parser Node.
- For the ALB, we select a
delimited_textconfiguration. - For the Java Stack Trace, we use a standard Grok pattern (
%{LOGLEVEL:log_level}...).
2. The Transformation Logic (Low-Code Eval)
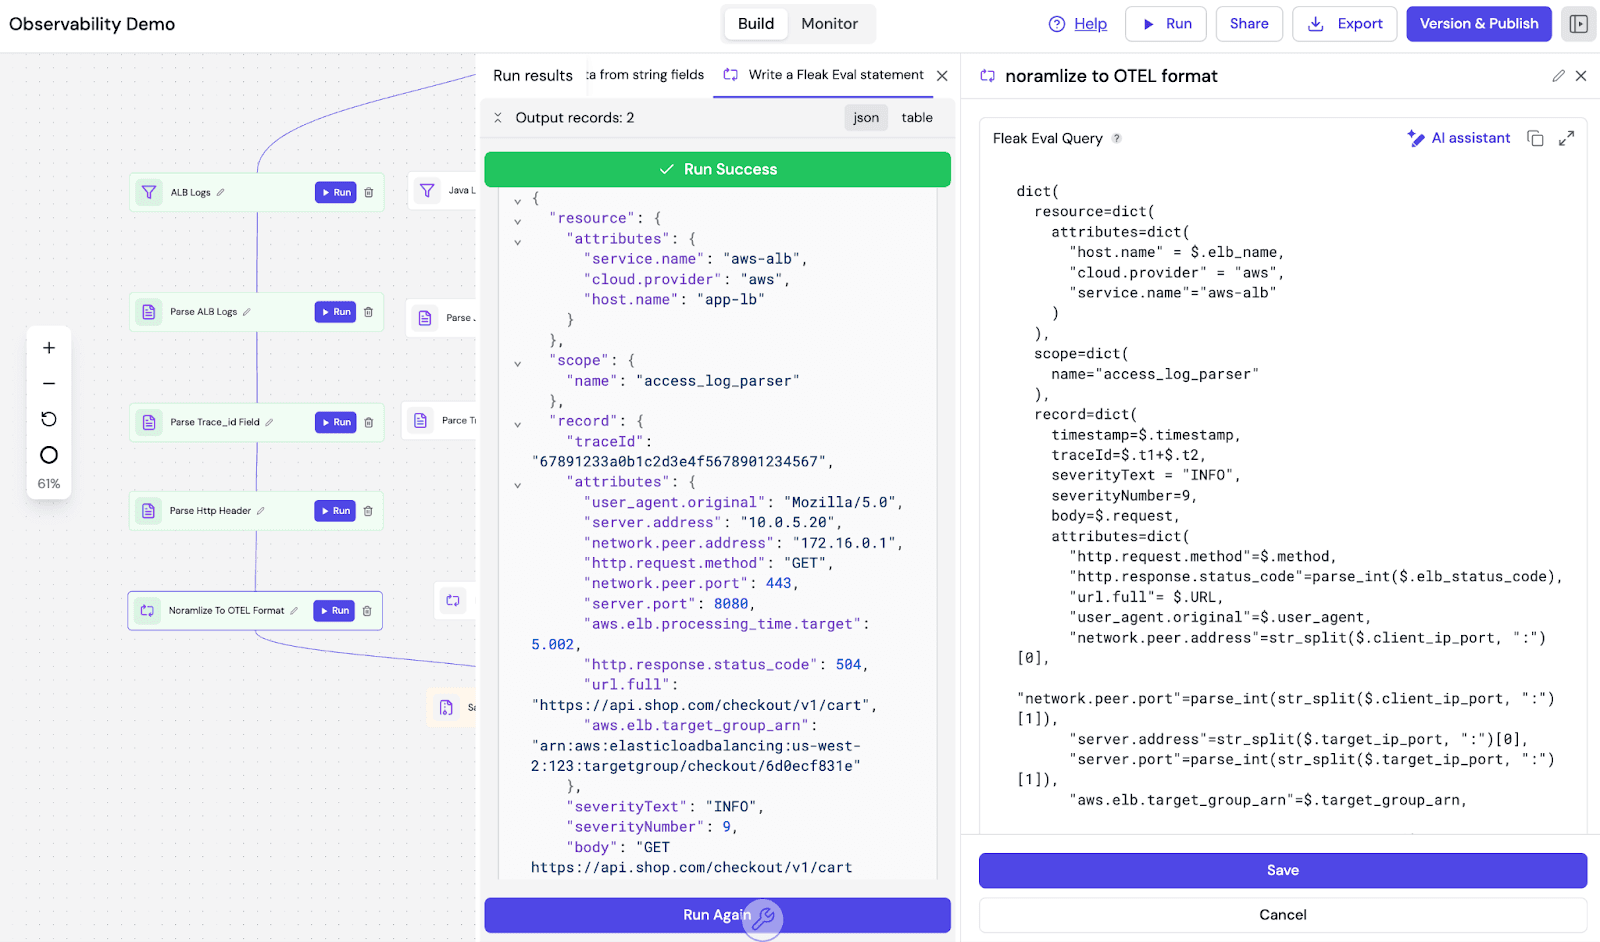
This is where the actual normalization happens. We use Eval Nodes to transform the proprietary fields into the OTEL schema. Fleak uses a Python-like dictionary structure for this, which allows us to define the output schema declaratively.
Here is the actual configuration used to map the ALB logs. Notice how we handle the Trace ID (t1=67891233, t2=a0b1c2d3e4f5678901234567) normalization ($.t1+$.t2):
dict(
  resource=dict(
    attributes=dict(
      "service.name"="aws-alb",
      "cloud.provider" = "aws"
    )
  ),
  record=dict(
    # normalizing the trace ID by concatenating the parsed parts
    traceId=$.t1+$.t2,

    # Mapping vendor status code to OTEL semantic convention
    attributes=dict(
      "http.request.method"=$.method,
      "http.response.status_code"=parse_int($.elb_status_code),
      "network.peer.address"=str_split($.client_ip_port, ":")[0]
    )
  )
)
This declarative approach is significantly faster than writing and testing custom transformation scripts. We define the target schema (OTEL), map the incoming fields, and Fleak handles the execution optimization.
3. Enforcing the Contract
Finally, the pipeline terminates in a Delta Lake Sink. Unlike a standard S3 dump, we enforce an Avro Schema at the sink level. This guarantees that every record landing in our data lake complies with the NormalizedLogRecord contract. If a log fails validation, it is dead-lettered immediately, preventing data swamp corruption.
Engineering Trade-offs
Moving normalization into the pipeline isn't free. It adds compute overhead and creates a stricter dependency on your ingestion infrastructure. If the pipeline backs up, your logs are delayed.
However, the alternative is paying that tax during an incident. When we keep logs in their raw, vendor-specific formats, we force every engineer to become a parsing expert at 3 AM.
In our simulation, normalizing the Trace IDs didn't magically fix the memory leak. But it did allow us to skip the twenty minutes of "grep-and-hope" that usually precedes the actual diagnosis. It turned a data formatting problem back into a regular engineering problem.